
ANALYTICS DASHBOARD · TOUCHLESS INTELLIGENCE
Analytics Dashboard: see your touchless rate and what lifts it
Find out why documents stop, fix the cause that matters most and measure whether it worked, right inside DocBits.
400+ customers
Over 96 % recognition accuracy
ISO 27001 certified
Native for Infor LN, M3, CSD and SAP S/4HANA
You know invoices get stuck. Now see why.
Some invoices still need a person. The harder question is which ones, why, and what would change it.
You correct document after document instead of fixing the cause once.
You can't tell whether a delay comes from a supplier, a setting or an approval.
When you change something, you can't show that it helped.
One dashboard, two questions
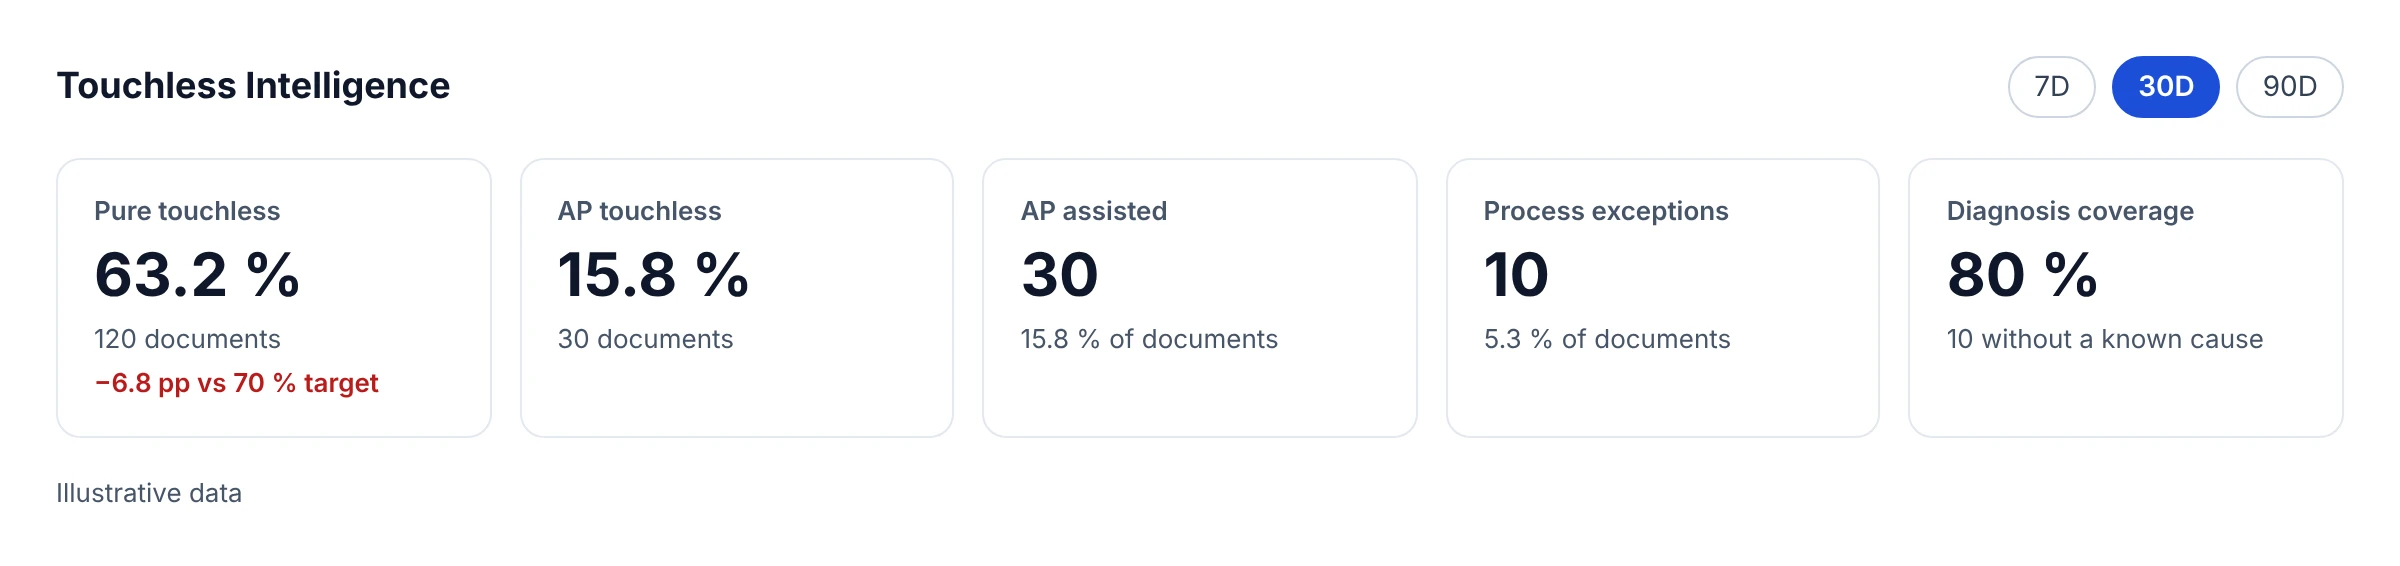
In the DocBits Analytics Dashboard, you see where time is lost and what runs without anyone touching it.
1. A touchless rate you can defend
Every document ends with exactly one outcome. Only finished documents count, so an invoice that arrived five minutes ago cannot pull your rate down. Once a person has touched a document, it stays counted as touched, even after a restart. Your rate reflects the work that actually happened.
How the rate is calculated
Touchless rate = (pure touchless + AP touchless) ÷ all documents with a final outcome
You set your own target (70 % by default). The figures are recalculated every 15 minutes.
Example calculation
200 documents arrive in 30 days. 190 have a final outcome: 120 pure touchless, 30 AP touchless, 30 AP assisted, 10 process exceptions.
150 ÷ 190 = 78.9 % touchless
(illustrative numbers)
2. See where documents stop first
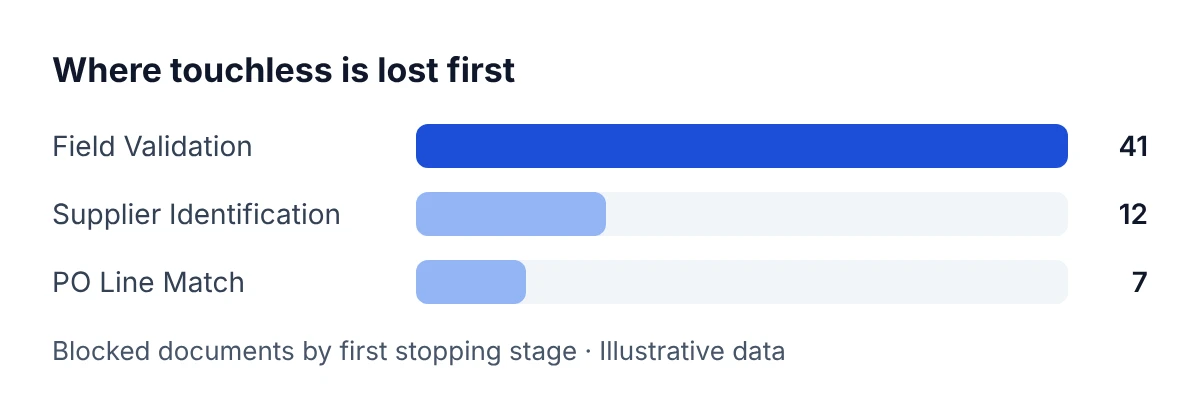
DocBits records each document's path through 14 pipeline stages, from intake and supplier identification to field validation, PO matching, approval and export. You see the first stage that stopped each document, so you know where to look first.
Documents from one supplier that stop for the same reason are grouped into one issue cluster. Instead of 40 single problems, you see three. Diagnosis coverage shows for how many blocked documents the cause is already known.
When the purchase order is the problem
See whether a PO match failed because the PO number was missing or wrong, the supplier uses its own item numbers, or price or quantity fell outside your tolerance. Each cause is marked as fixable in DocBits or supplier action only, so you know whether to adjust a rule or contact the supplier.
Follow one document, stage by stage
Enter a document ID to see what happened at every stage, including each restart.
3. Fix the supplier that moves the needle
The supplier with the most problems isn't always the best place to start. Touchless Intelligence ranks suppliers by expected lift: how many percentage points your organization's rate would gain if their recoverable documents ran touchless.
Supplier B has more lost documents, but most of them can only be fixed on the supplier's side. Start with Supplier A. Compare two to five suppliers side by side to find out whether a problem lies in the layout, in your master data or with the supplier.
4. Change it, measure it, undo it
When a cause can be fixed in DocBits, the recommendation comes with a concrete change. Administrators work through it in four steps:
Preview
See the current and the proposed value before anything is saved.
Apply
Save exactly the previewed change. Every change is logged.
Measure
Compare the rate before and after over equally long periods, with at least 20 documents in each.
Undo
Take the change back if it doesn't help.
A before-and-after difference is an observation, not proof. A new supplier or a seasonal peak can move the rate too, which is why you always see the document counts behind each comparison.
Required field missing · Field Validation
Source: Hypothesis
Affected
28
Recoverable
28
Expected lift
+2.8 pp
Preview change
Illustrative data
AI that explains, not decides
AI writes the explanations. Every cause shows its source: rule-based, AI hypothesis or confirmed by a person. Settings change only after an administrator has previewed and applied them.